Open Notifications from the main navigation. The page separates what happened from where the update goes:
- Incidents group related events and keep their history across agent restarts.
- Rules select events by source, severity, node, deployment, and incident stage.
- Targets deliver updates through email, webhooks, or another supported Shoutrrr destination.
How incidents reduce noise
Events with the same correlation key belong to one incident. The first event opens it. Related events increase its count. A recovery resolves it. Repeated events do not create a new email every few seconds.
Every delivered update includes an incident ID. Give that ID to an administrator when you need help matching a message to the incident recorded in FlatRun.
Add a delivery target
- Open the Targets tab and select Add target.
- Choose email, webhook, or a custom Shoutrrr URL.
- Use Test before relying on the target for incidents.
- Save the target and leave it enabled.
Saved target credentials are masked in API responses. Editing a masked target does not reveal its stored password or token.
Control which updates are delivered
Without delivery rules, every enabled target receives incident updates. Add a rule when a team should receive only a subset. All selected filters in a rule must match.
- Topic: fleet, capacity, security, backups, certificates, or deployments.
- Severity: critical, warning, or informational.
- Scope: selected nodes or deployments.
- Incident stage: opened, updated, or resolved.
- Targets: the destinations that receive a match.
Review an incident
The Incidents tab shows the latest event, affected node or deployment, event count, status, and incident ID. A resolved incident remains available so you can see what recovered and when.
What an email contains
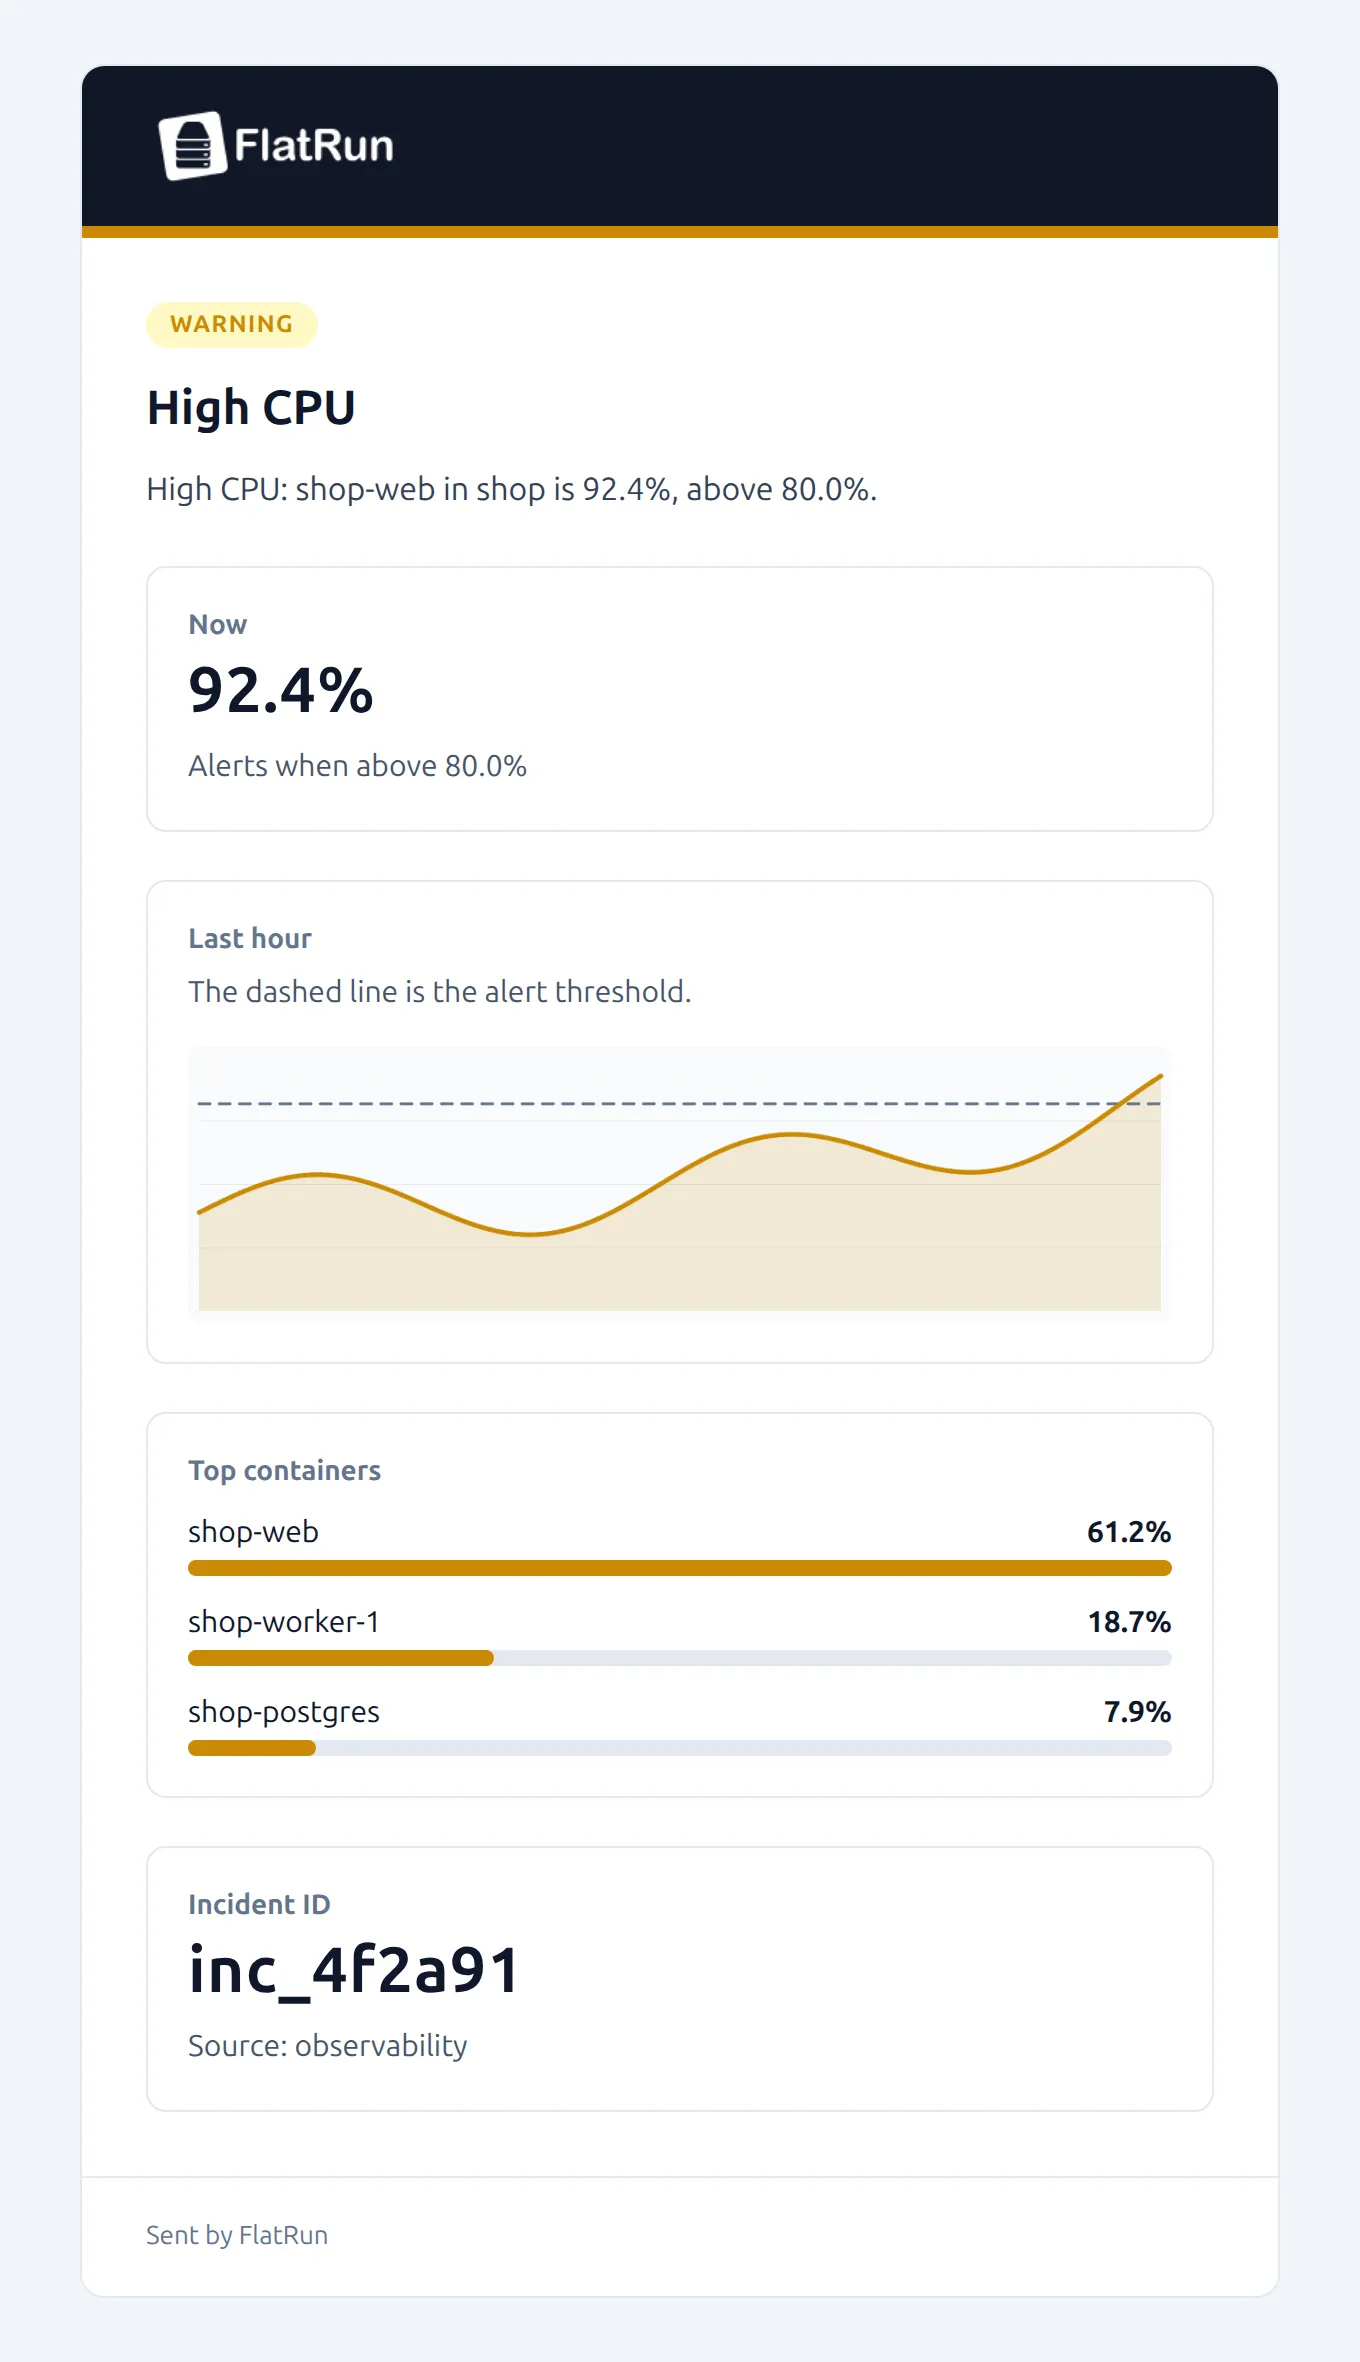
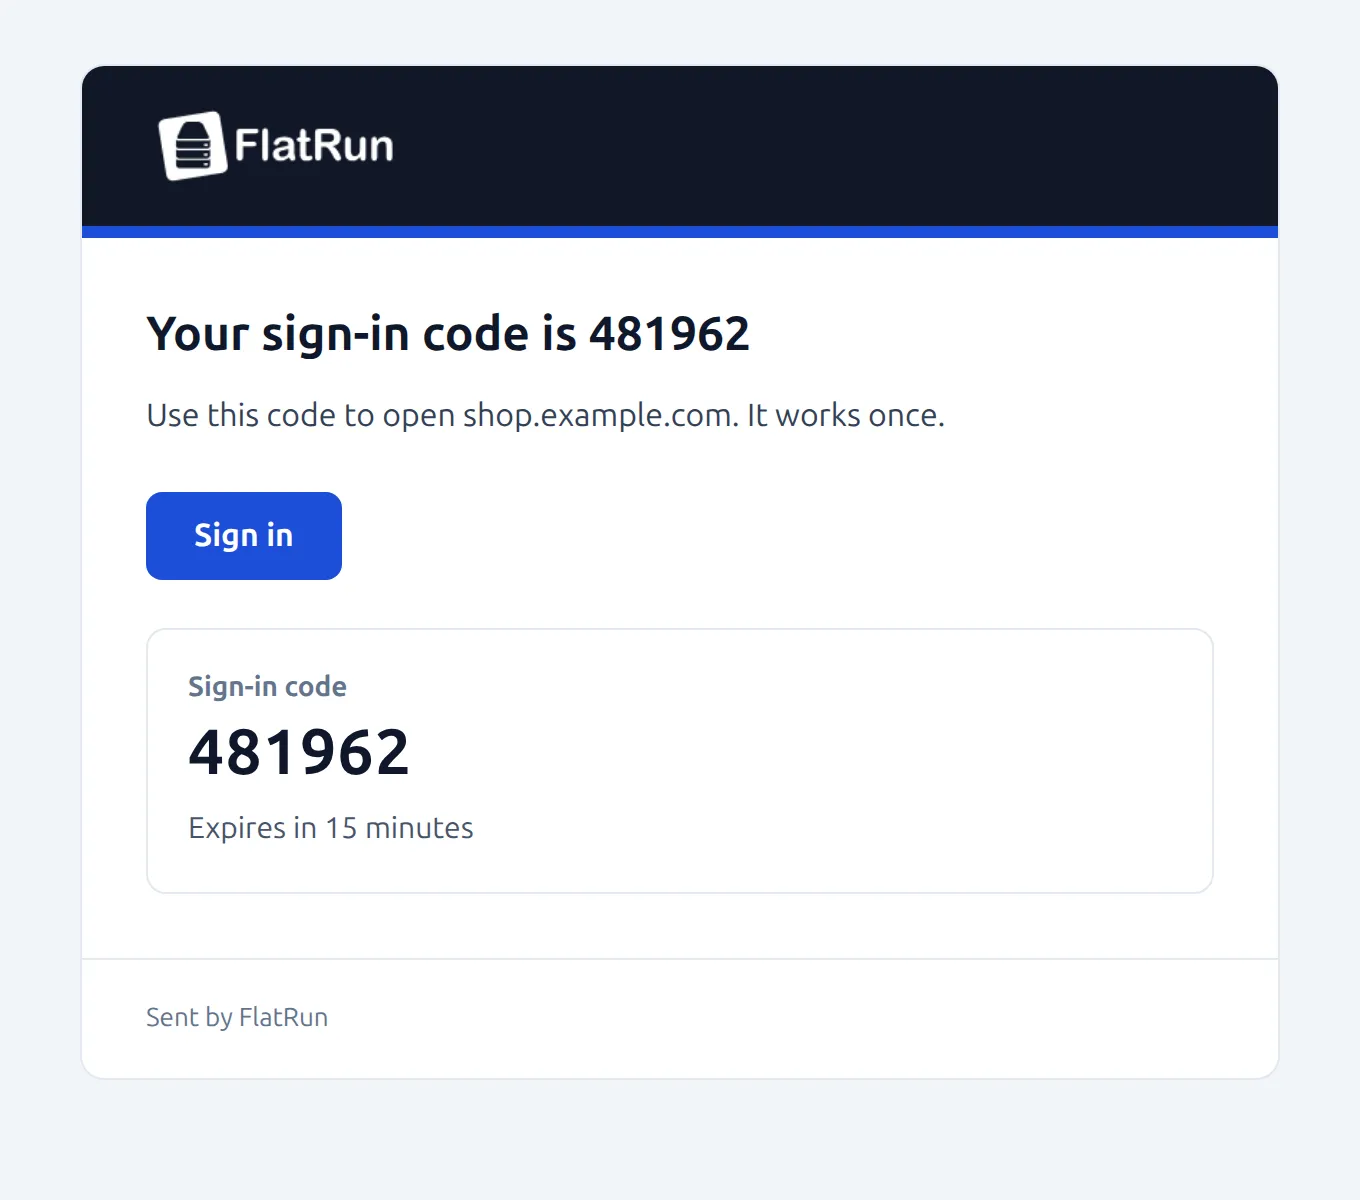
Every email has the same layout: the FlatRun header, a coloured strip that shows what kind of event it is, the message, and panels with the details. The column stays 600 pixels wide, so emails read the same on a phone and in a desktop client.
| Strip | Sent for |
|---|---|
| Red | Critical events, such as a deployment that failed to start |
| Yellow | Warnings, such as a metric alert crossing its threshold |
| Green | An incident that resolved |
| Blue | Information, such as sign-in codes for protected domains |
A metric alert shows the numbers behind it:
- Now: the reading that triggered the alert and the threshold it crossed.
- Last hour: a chart of the metric, with the threshold drawn as a dashed line.
- Top containers: the containers using the most of that resource, as bars.
- Incident ID: the incident this email belongs to.
Links appear as buttons. Mail clients that show plain text get the full address instead. Charts are attached as images, because mail clients do not run scripts.